
Our Approach
If you are similar to all of our clients in our initial meeting, you will say “we have a strategy, we know what our industry is doing, and we have grown up in this industry and understand all the players.
To which we ask, “then why are you talking to us? You may have a strategy, but is it the right one for your situation, your time?”
The usual answer is, “Something different is happening, our products/services are not as successful, profitable, innovative (put your answer here______) as we thought. And we don’t quite understand why this is happening.”
How long has this been going on? “A year, 2 years, 5 years… so we thought we should have another set of eyes take a look.”
This is the crux of the problem for many of our clients: If you throw a frog into boiling water, it will jump out immediately. If you put the frog into lukewarm water and slowly heat it, the frog will become steamed/cooked frog. Things that happen slowly, modestly, incrementally, always cause us to wake up one morning and say, what happened?
The Art of Strategy is to develop a construct that explains what is happening and why it is happening, then maintaining a vigilant eye to changes that occur in the composition of the industry, competitors, customer needs, competencies, application of technologies, partnerships/acquisitions, new internal/external activities, and changes in management focus. It is a tedious process but one that keeps one keen and focused and on top of your game. Once you know how to do it, the pieces fit in place to explain seeming inconsistencies within your industry.
Strategy requires dealing in pieces of information/data to put the puzzle together. Most strategists have been trained to observe cause and effect, usually across multiple industries and markets. They can read the tea leaves, sense a movement in the leaves, and understand when the ninja’s will attack. It is not something taught in any graduate school of business, but rather learned empirically by doing.
The tool set used by professional strategists consists of weird but interesting graphics, constructs, financial analysis, trend observations, rules of thumb by industry, as well as a body of knowledge built from academia and applied to real world situations (think experience curves, substitution analysis, etc.)
Becoming a strategist is not for the light of heart: it takes years of study, miles and miles of travel, discussions with hundreds to thousands of clients, and intensive, rigorous analysis. Most of its practitioners are bi-polar: they struggle mightily trying to find data to perform the work, and when they hit the answer, they are on a supreme ‘high’ unmatched by any drug. This is unfortunately why the number of strategists equals the number of Jedi-Knights. It is a dying breed, as everyone believes the Internet and Wikipedia will provide the answer. Nothing could be further from the truth or more shallow.
That said, let’s walk through the elements of a typical analysis that a strategy expert might do.
Industry & Market Trends
This analysis is pretty straightforward: who are the participants within your market/your industry? What do you know about them? How large are they, what are they composed of, how do their products/services compare to yours? What are trends that are occurring in terms of what customers are demanding and how are their needs changing? You will portray the usual suspects. Have you included hungry international competitors? Have you incorporated new ways of performing the function that your product/service does? Have you noted what, where, and how your competitors have begun focusing? We are not talking about major shifts, but minor, incremental changes. Again, you boil in the pot but letting it get warmer and warmer and warmer.

If you were to plot all of the suppliers to your industry by size, by share of market, and by growth over the past few years, what would it look like? Too many variables? Maybe a ‘bubble chart’ from the 1970’s management consulting firms could provide a different perspective. Look below. This chart portrays a big part of the electronic contract manufacturing industry, circa 2015. Note that there are both big and small players, their revenues represented by the area of the circle; the bigger the circle, the more the revenue.
The Y-Axis shows compound annual growth over a number of recent years. The X-axis shows relative market share (what we mean by this is that how much larger is the biggest company relative to the next biggest company. Then plot the rest of the companies relative to the biggest company.) Then draw a line that shows the average growth of the entire industry.
So, this is how you read this universe. A number of large players competing to take first place, a number of mid-size to smaller players who may offer either unique product or me-too product, but competing with others in the same industry. The overall reaction is, so what?
Lets see how a strategist would read this chart. First, look at the average growth dotted line. If the center of your circle is above this line, you are growing faster than the industry average, thus taking market share. Obvious questions are: what are you doing that is different from others?; is it sustainable?; are you making money doing this?
If you are below the dotted average growth line, it suggests you are losing market share. This is typically not a good place to be. It would suggest that you either have a limited lifetime until the bigger or more innovative companies eat your lunch, or that you are being allowed to exist as the bigger companies don’t care about your product/service offering as they are pursuing more lucrative areas, or you are dealing with end-of-life product/services that have no future, and thus you are allowed to exist.
The point of this construct is to make you aware of what is happening within your industry. It is a function of when you create the chart, as companies shift constantly (think of a solar system revolving around a sun). A key observation to take away from the growth perspective is, if you are not growing, you are shrinking. If not today, certainly tomorrow. That is ok if it is your strategy, but if you think you are planning on being multi-generational, growing to go public, wanting to reward your shareholders, without growth you are helpless.
Let’s now look at the X-axis. What does it mean to be relatively larger than your competition? Emperical studies of MANUFACTURING companies show that if you can become 1.5 times larger than your competition, you can leverage economies of scale and economies of scope. Got that? Economies of scale means that you can leverage purchasing power to buy supplies more economically than your competition .You may be able to get preferable terms from your lenders. In essence, if you are paying attention, bigger is better. Economies of scope means that you can afford to offer variations on a theme of the product or service. You can go through multiple channels to market, afford more sales effort, configure products and service to international and/or marginal customers.
If you are a SERVICE company, some of these concepts still apply, but to a lesser extent. For example, if you provide cleaning services to corporations, and cleaning supplies are a large part of your cost structure, then size makes a difference. If labor is your largest component, then the effect of purchasing power is less. If you are an Amazon, then the question becomes how can you leverage your overhead/infrastructure to offer additional services and products to customers? Amazon allows companies to create websites in conjunction with them, get their distribution, presence, and shared Brand. Is this powerful? Of course!
So, there is a lot more to this work effort than you originally thought. How do you segment your market, who are your real competitors, what do they offer that you don’t, how many shared activities do they leverage that you don’t have (or conversely, that you have but are not using effectively)?
Customer Needs
If we were to ask you if you understood your customer’s needs, what would you say? “Of course we do, they buy products and services from us, right?” Our answer would be, of course they do, but what are they planning on doing? How have competitors eroded your advantage, or conversely, how can you erode theirs?
A wonderful methodology of determining customer needs is conjoint analysis. This methodology was originally refined by Professor Green at the University of Pennsylvania in the 1970’s. (Have you noticed that the 1970’s were a green field for management consulting? And of course, for some of the best music ever made. Go figure.) Conjoint analysis works like this: If we were to ask you how you evaluate a purchase of a new car, you may not be able to explain it to us. But the human brain works on multiple levels: it looks at the size of the engine, gas milage, color, dealer, repair record, sound system, stage of life, cost, tire size, noise level, sound system, and 14 other variables. The beauty of the human mind is that it compresses this analysis easily and quickly and you buy a car. There is a mathematical approach to doing the same analysis by showing you different options: big engine vs color; mileage vs sound system, convertible vs large tires, etc. If we showed you enough of these tradeoffs, and ran it through the right software, we could predict what you would buy with 99% accuracy.
Who has the time to do that at Corporate customer/supplier relationship level? Maybe P&G, but for the rest of us mortals, there are shortcut methodologies that do about as well a job at a level of 90% (I made that up, but it seems so from years of experience) level.

We call this a ‘comb chart.’ Think of a comb on its side. On the horizontal scale, you ask a VP of Purchasing (or other decision maker) what are the most important things they consider when buying products or services? We have found that these senior level people welcome this type of involvement. It is not a waste of their time and usually it is an interesting diversion from their day to day job. There are usually 5-7 elements. Then, you ask them to rank order which are most import to them. They will automatically know the answer to this because they have years of experience that their brains have incorporated into their decision making process. It is exactly a conjoint analysis without all the hard work.
Next, ask them how your company stacks up relative to all of these decision criteria (look at the Green Line). You may be surprised. This test is usually best performed by an independent consultant such as Avalon, as relationships (wives, families, golf expeditions, Christmas presents, etc.) get in the way when our client is present. The results are ALWAYS revealing to our clients. The results are usually fascinating to them.
This is always a good forum to ask how the competition meets the customer’s needs (Blue Line). While you may think the VP may play games, if you ask these same questions to 3 to 5 participants, the average will invariably even out. And it is usually in the best interest of the interviewee to provide you with honest answers.
How to read this chart: What you look at first is what the customer values most, for example, this customer values Performance (referring to a product or service offering), Service, and Price. Salesforce (direct vs distribution) and Image (think Brand), are not very important. The next thing to recognize is the difference between the customers key purchase criteria (Performance, Service, Price) and what you as a supplier are offering versus what your competition is offering. Look for ‘gaps’. For example, your product has a large gap in both Performance and Service compared to what the customer needs. Your direct sales force and Brand Image are both great, but far in excess of what the customer needs. So, your company is having problems addressing this particular market. You are wasting money supporting a direct sales force and Brand advertising that the customer doesn’t value, at the expense of investing more into product performance and service which the customer does value. The interesting thing about the rankings shown by these comb charts/conjoint analyses, is that they typically reflect market share positions by the suppliers to the industry. That is, the better you serve the customers with targeted products/services, the better the market share position you will have. This may seem like common sense, but we all know how little of that there is.
Example: An Avalon client manufactured a specialized data recorder that was purchased by the Navy. Sales of this product buoyed their divisions sales and profit for many years. When we questioned trends within the data-acquisition market (digital recorders, speed, storage and processing capabilities), our client told us that was not important. What was important was the ‘loyalty’ of the Admiral who was in charge of purchasing this product and that he ‘loved’ our client. We spent half a day talking with this senior person, to discover that in his next purchase of data recorders, he was significantly downsizing any future purchases from our client, because they had not kept up with technology and were too expensive. Needless to say, our client was flabergasted. The Admiral had been telling the client salesperson that this was an issue for well over a year, but the salesperson either didn’t hear it or didn’t want to hear it.
Avalon has found that the value of ‘loyalty’ with a long term customer is worth about a 5% to 7% difference in an important customer decision criteria. That is, a long term, loyal customer will give his long term supplier some slack to catch up, provide the right product, or otherwise rectify the situation. For this particular client, they had procrastinated for such a long time that there was no way, short of an acquisition, that they could catch industry leaders. This division was eventually spun off from the parent, all for the lack of listening to what the customer was saying.
Example: One of Avalon’s clients supplied envelopes to FedEx. During the discussion of purchase criteria, we found that our client provided exceptional service and products and FedEx loved them. But our client only had 50% of the business due to the need for a second source. The client’s salesperson was accompanying us during this interview and thought everything was great. After hearing the feedback from the VP Purchasing, we asked, if our client meets all your needs, why can’t we have all your business. A ten second delay, and the VP said, “OK, but you need 2 plants.” The salesperson fell off his seat, because he was happy with 50% of the business and didn’t recognize the value his company was providing and was ‘afraid’ to ask for more. This was a multi-million dollar contract.
Competition
What would strategy be without the ability to assess competition? The manner in which Strategists like to think about competition is twofold:
• Who are your ‘like’ competitors
• Who are your ‘functional’ competitors
Like Competition, as the name implies, make products or provide services that are similar or identical to what you offer. Most companies view the competition through the eyes of their own organization, assets, locations, and people. That is, it is assumed that for someone to serve the same industry, that suppliers within this industry look-alike. Of course, as we have suggested earlier, this is where the wheels begin to fall off the wagon. Variations that can occur:
Scale: if suppliers are over 1.5 times larger than others, there are economies of scale that provide a price/cost advantage and perhaps a scope advantage in products offered.
Activities: This is a unique way to look at competitors and many times explains why one supplier can significantly out-perform other suppliers within an industry. If you were to do a flow chart of how all of your products begin, get processed, and get delivered to market, we define all of these discreet steps as ‘activities.’ The chart below shows an example. This also can address unique processing steps within an operation that are considered trade secrets (think Coke).
Regulation: Competitors may have a unique heritage, political or otherwise, or own patents.
Location: Competitors may own unique assets (forests) or be located at special sites (ports, over mineral or gas or oil deposits)
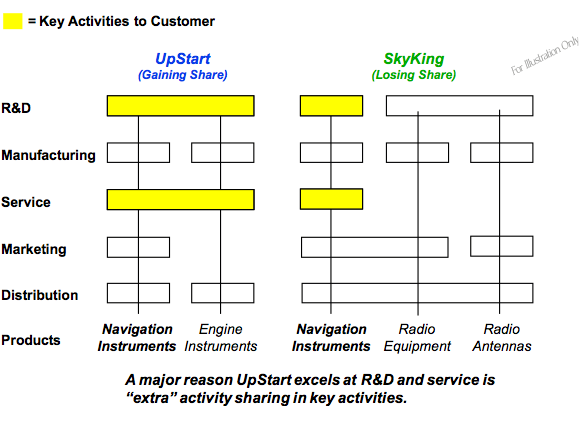
The importance of identifying these activities in such a fashion is that you can have a detailed discussion about how your competition is performing the same activities and whether their approach is more cost effective, creates better or more products, which are delivered faster or more conveniently, etc.
Example: One of our clients manufactured a unique rare earth mineral, taking it from the mine, processing the ore, and refining it to the purity levels demanded by customers. They were losing market share and discovered that their competition was selling at 75% of their cost, so the immediate response was that the competitor was dumping. Upon closer analysis, we found that the competition mined and processed not only one rare mineral, but five. And one of the key value-added steps within this process required an expensive melting operation (which our client also had). But the competition invested in a larger, much more expensive melt operation that could handle all 5 minerals. When we estimated the volumes of material that flowed through this ‘activity’, the per unit cost of the operation was significantly lower than our client’s cost. That is, when the cost of the melt operation was amortized over the amount of material that flowed through it, there was a significant reduction in cost due to the higher, non-related volumes of product. This seems like common sense, doesn’t it. The more you put through any given activity within a process chain, the less the cost per unit of that particular activity. The point is, one has to look closely at how your competition is configured to serve a market before you reach any conclusions about their strategy, and more importantly, your strategy.
Experience Effect: Within all strategic analyses one must take into consideration the ‘experience effect’, sometimes called the ‘learning curve.’ This empirical observation suggests that the more you do something, the better you become at doing it, which results in faster, better, cheaper results. For example, if you tried to compete with a company manufacturing automobile tires, and they had 50 years and 50 million tires worth of experience, you would be at a severe disadvantage in every category. Unless of course, you have a breakthrough technology that affects a significant part of the value-added process. The chart below helps to illustrate this concept, showing how Honda moved down the experience curve by incorporation of small internal combustion engines into multiple product lines.

It is important to note that the experience curve works differently within different industries. A rule of thumb is that for semiconductor manufacture, every doubling of accumulated volume results in a decrease in cost of 10% to 20%. Within a service industry, every doubling of accumulated volume many only result in a decrease in cost for that service of 3% to 5%. Accumulated volume refers, for example, to manufacturing 1 unit, then 2, then 4, then 8 then 16, etc. It is not linear.
Functional Competition: By this we mean that one can accomplish a task in many different ways. For example, to get from Boston to NYC, one could fly, take the plane, drive, go by ship, or walk (and many other variations). The same is true for manufacture of products or provision of services. Books used to be only found in book stores, B&N, Borders, libraries, and 1,000’s of local stores. Amazon changed all that with a totally different delivery system of a commodity product. Software in the corporate environment is going through a similar change, where software as a service is being offered and the server is at the software provider’s site, not at the user. Most of Apple’s app’s reflect the ability of a smart phone to provide a unique way of using mobile ability and technology to totally change what is offered.